Tucker Financial Weekly Market Review: July 8, 2022

Weekly Market Report: July 8, 2022

In a Fourth of July holiday shortened trading week markets digested a handful of economic reports and waited in anticipation of the upcoming 2Q earnings season to kick off. Risk appetite seems to have clearly shifted from valuation centric selling pressure to more concerns surrounding the outlook for growth and corporate earnings pressure. By the end of the week, the S&P 500 added 2% with the best performance coming from the most beat up sectors on the year (technology, consumer, communication) while energy, materials, and utilities lagged. Interest rates bounced last week, moving approximately 25bps higher across the curve, leaving 10yr yields back above 3%. Commodities (-3%) lost more ground with oil down 3.4%. The USD enjoyed another strong bid, up 1.8% on the week, taking year to date return to a whopping 11.8%

Market Anecdotes

  • A not so surprising anecdote is that the S&P 500 marked its low point in mid-June corresponding to a highwater mark in interest rates and oil prices.
  • Up until June 8th, the Energy sector was the only thing working in the market. However, the sector has reversed dramatically with oil closing below $100bbl and energy stocks falling close to 25%. That said, supply side dynamics should keep oil prices relatively firm.
  • S&P 500 earnings are expected to rise 4.3% which should translate to approximately 9%-12% based on historical beats and leaves the S&P on track for 10% growth for the calendar year.
  • June FOMC meeting minutes released last week revealed taming inflation and salvaging credibility as key considerations alongside testing the Fed’s resolve, long run inflation expectations breaking from the Fed’s 2% target, and inflation risks being skewed to the upside.
  • Incoming data and the economic outlook will continue to inform the Fed including likely inflation pressure relief from falling commodity prices, declining shipping rates, easing supplier delivery backlogs, labor market dynamics, and shifts in consumption from goods to services.
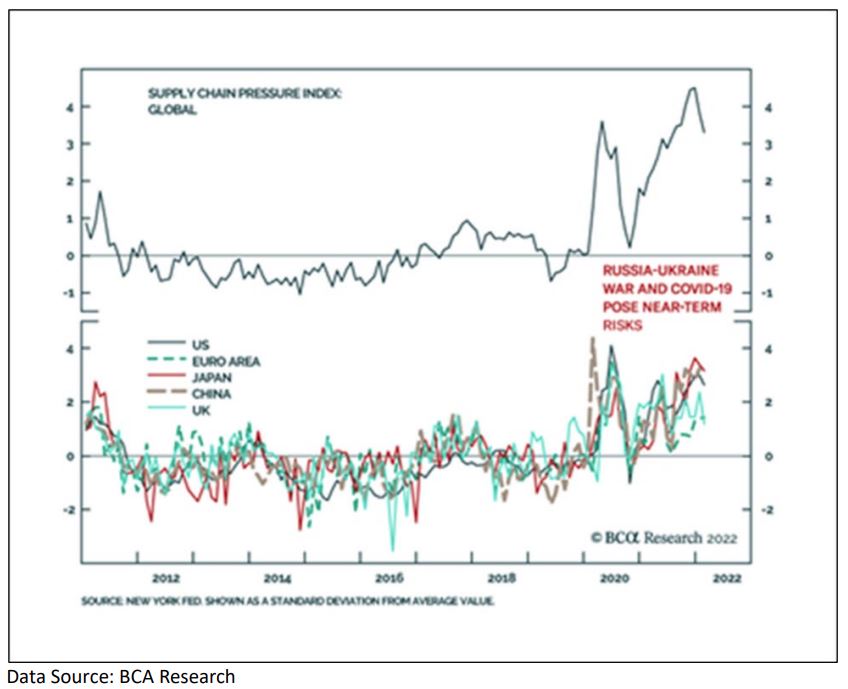
  • Supply chains are continuing to heal. ISM survey respondents reporting commodity categories in short supply have fallen from 36 to 13 in manufacturing and 33 to 14 in services while the GSCPI from the NY Fed also confirms easing pressures.
  • Reports out of China suggesting that the Ministry of Finance is considering allowing local governments to bring forward 1.5 trillion yuan ($220 billion) of next year’s special bond issuance to the second half of this year catalyzed a rally in Chinese equities last week.

Economic Release Highlights

  • The June Employment Report revealed 372,000 new jobs, comfortably beating the consensus estimate of 270,000. The unemployment rate stayed at 3.6%. Average hourly earnings MoM of 0.3% and YoY of 5.1% were generally in line with consensus. 
  • June ISM Services Index (55.3a vs 54.8e) came in slightly higher than the consensus estimate. 
  • June’s final U.S. PMI readings (C, M, S) of 52.3, 53.0, 52.7 saw a slowdown in manufacturing but more resilience across services with an upward revision to the flash report from the prior week. 
  • The JOLT Survey reported 11.254 job openings. 
  • China’s Caixin non-manufacturing PMI jumped to 54.5 in June from 41.4 in May.
    This communication is provided for informational purposes only and is not an offer, recommendation or solicitation to buy or sell any security or other investment. This communication does not constitute, nor should it be regarded as, investment research or a research report, a securities or investment recommendation, nor does it provide information reasonably sufficient upon which to base an investment decision. Additional analysis of your or your client’s specific parameters would be required to make an investment decision. This communication is not based on the investment objectives, strategies, goals, financial circumstances, needs or risk tolerance of any client or portfolio and is not presented as suitable to any other particular client or portfolio.

    Secure Your Retirement

    Retire With Tucker

    Receive our market reports directly to your inbox.

    303-734-1234

    Tucker Financial Weekly Market Review: July 1, 2022

    Weekly Market Report: July 1, 2022

    In a week that saw the S&P 500 wrap up its worst first half in over 50 years (1970), equity  markets delivered a fourth losing week out of the past five, remaining squarely in bear market territory as investors continue to look for guide posts in the second half. The week brought us some highly anticipated economic data on inflation, housing, and consumer confidence. U.S. equity markets were off approximately 2.3% while non-U.S. markets fell 1.7% with weakness again in technology/consumer and strength in utilities/energy. Bonds rallied sharply as interest rates fell again, leaving the 10yr now back below 2.9% while commodities lost 2% and the USD rallied 0.9% in a flight to safety bid.

    Market Anecdotes

    • With the second quarter and first half officially in the books, it warrants acknowledging the historic stock, bond, and commodity market returns thus far in 2022.

    • The S&P 500 has repriced itself by -24% in P/E multiple terms heading into 2Q earnings season where consensus 2022 earnings sit at $229.23, a 10% increase over 2021 earnings.


    • The notable change in Fed focus and tone in mid June when officials noted “economic activity appears to have picked up” has become more curious given the slowdown in both economic and inflation data. The paths of inflation and rate hikes remain pivotal input for risk assets.


    • The outlook remains very unclear with the bullish view that $2.2t in savings will provide a significant boost to consumption offset by the bearish view that inflation is exacting a damaging impact on purchasing power and real consumption.


    • The shift in consumption from goods (-$43b) to services (+$76b) continued in May which should be helpful for inflation pressures but it remains unclear whether the increase spend on services will offset declining demand for goods.


    • Probability that the U.S. economy is in recession continues to increase with the most recent Atlanta Fed GDP Now model estimating a 2.1% contraction, following Q1’s 1.6% decline.


    • A look at the yield curve shows both the 10yr-3m and 10yr-2yr slopes are still in positive territory but the 10yr-2yr is approaching the 0% threshold.

    Economic Release Highlights


    • PCE headline inflation for May came in MoM at 0.6%a vs 0.7%e and YoY at 6.3%a vs 6.5%e while core inflation registered MoM at 0.3%a vs 0.4%e and YoY at 4.7%a vs 4.8%e.


    • Personal Income and Outlays report for May reported underwhelming consumption expenditures (0.2%a vs 0.5%e) and at consensus personal income (0.5%a vs 0.5%e).


    • The June ISM Manufacturing Index came in slightly under consensus (53a vs 55e) but did fall within the broader consensus range of 52 to 56.


    • Durable Goods Orders for May came in above consensus (0.7% vs 0.1%). Ex-Transportation (0.7% vs 0.4%) and Core Capital Goods (+0.5%) were also relatively strong.


    • Pending Home Sales Index for May of 0.7% beat the consensus call of -2.5% and registered above the high end of the range of estimates (-4.5% – 0.0%).


    • Case-Shiller Home Price Index for April came in at consensus 1.8% MoM and 21.2% YoY price increases.


    • Consumer Confidence for June of 98.7 came in slightly below expectations of 101.0 but fell within consensus range of 95.0-104.0.
    This communication is provided for informational purposes only and is not an offer, recommendation or solicitation to buy or sell any security or other investment. This communication does not constitute, nor should it be regarded as, investment research or a research report, a securities or investment recommendation, nor does it provide information reasonably sufficient upon which to base an investment decision. Additional analysis of your or your client’s specific parameters would be required to make an investment decision. This communication is not based on the investment objectives, strategies, goals, financial circumstances, needs or risk tolerance of any client or portfolio and is not presented as suitable to any other particular client or portfolio.

    Secure Your Retirement

    Retire With Tucker

    Receive our market reports directly to your inbox.

    303-734-1234

    Tucker Financial Weekly Market Review: June 24, 2022

    Weekly Market Report: June 24, 2022

    We saw some typical bear market activity last week with equity markets continuing to churn, this time to the upside despite mounting evidence of a cyclical slowdown and global central banks chasing commodity prices. Some inflation data out of the U.K. and Germany provided some encouraging data points while other economic data made clear economies are still expanding, though at a decelerating pace. U.S. equity markets enjoyed a nice rally last week of over 6% while developed international (+3.75%) and emerging markets (+2.5%) were up but not as strong. Bond markets enjoyed further decline in interest rates while the USD lost a little ground and commodities, thankfully, did as well.

    Market Anecdotes

    • With the S&P 500 officially in a bear market, the key questions are how much deeper and how much longer? Depth and duration of the economic slowdown currently unfolding will be the determinant but either way, we’re on track for the worst six month start to a year since 1932.

    • Wall Street analysts have been slow to adjust their year-end price targets for the S&P 500 with the S&P 500 now trading over 20% below its bottom-up consensus analyst price target – one of the widest divergences on record.

    • Market and sentiment-based inflation expectations alongside inflation data continue to paint a concerning but mixed picture, particularly with a focus on headline data series.

    • Some of the differences between CPI and PCE inflation include fixed versus dynamic weightings and differing data sources with the key differences in shelter and medical costs.

    • Economists surveyed by The Wall Street Journal have dramatically raised the probability of recession, now putting it at 44% in the next 12 months, a level usually seen only on the brink of or during actual recessions.

    • An interesting look at the origin of U.S. company profits from the BEA and Goldman Sachs does challenge some of the narratives of achieving adequate diversification by owning a broad basket of U.S. companies.

    • A decoupling of U.S. consumer sentiment and unemployment has been one of the more remarkable reminders of the toxic power of inflation.

    • With much attention on the health of the U.S. consumer due to the exceptional job market and household liquidity measures, it’s worth noting debt service on the part of corporations is also in a good position.

    • Fossil fuel sales from Russia since their invasion of Ukraine have remained relatively stable but the composition has certainly changed and is expected to continue.

    Economic Release Highlights

    • Preliminary June PMI data saw broad based deceleration but remained in expansionary territory.
    • U.S. Existing Home Sales for May (5.41mm) were down 3.4% last month and stand down 8.6% year over year.
    • U.S. New Home Sales for May (696k) were up 10.6% over the prior month but are down 5.95% year over year.
    • The average 30-year mortgage rate edged up to 5.81%, a level not seen since the advent of the global financial crisis in 2008.
    • UofM Consumer Sentiment Index for June slid to 50.0, down from a 58.4 reading the prior month.

    This communication is provided for informational purposes only and is not an offer, recommendation or solicitation to buy or sell any security or other investment. This communication does not constitute, nor should it be regarded as, investment research or a research report, a securities or investment recommendation, nor does it provide information reasonably sufficient upon which to base an investment decision. Additional analysis of your or your client’s specific parameters would be required to make an investment decision. This communication is not based on the investment objectives, strategies, goals, financial circumstances, needs or risk tolerance of any client or portfolio and is not presented as suitable to any other particular client or portfolio.

    Secure Your Retirement

    Retire With Tucker

    Receive our market reports directly to your inbox.

    303-734-1234

    Tucker Financial Weekly Market Review: June 17, 2022

    Weekly Market Report: June 17, 2022

    Global central banks, inflation, and war in Ukraine combined to send equity markets to a second consecutive 5%+ decline as investors buckled up for a notable increase in the likelihood of recession. A primary driver was that the Fed made it pretty clear it had no intention of acknowledging financial conditions by stepping in to pause or ease or provide liquidity, unlike 1966 and 1987 – the only two bear markets on record that occurred without a recession in the general vicinity. Interest rates one year and shorter climbed 0.25% while maturities from 2yrs to 30yrs moved up a more modest 0.10%. Commodity markets fell 6% on the back of oil falling nearly 10% back to $109 and industrial metals were soft in reflection of global growth concerns.

    Market Anecdotes

    • The Fed hiked interest rates by 75bps on Wednesday, above the 50bp rate hike plan it had telegraphed at its previous meeting and made clear their renewed focus on issues being presented by headline inflation. The FOMC dot plot projections were also revised sharply higher. 
    • With ample red ink to swim in this week, we’ll note some green which is clearly evident in nearly all post WWII data showing equity market returns following bear markets, 15% quarterly drops, and 20% or worse six month drops. 
    • It’s been really rough sailing with nine of the last ten weeks closing out on a decline, something only three other periods can claim – 1970, 1982, and 2001. 
    • The year-to-date decline in S&P Growth of -30% versus S&P Value of -15% has brought their relative valuations quickly back into neutral territory and U.S. large caps (15.4x), U.S. mid-caps (11.1x), and small caps (10.8x) overall have fallen back into fair to cheap range. 
    • With inflation, and specifically the one including food and energy, now seemingly the focus of the Fed, the individual components and their trends warrant close attention. 
    • Recovery in U.S. labor market participation is a key underpinning to a more muted recession scenario potentially allowing payrolls to keep growing while the unemployment rate rises. 
    • Credit spreads in the bond market provide a good barometer of the overall economic anxiety level in the market and while high yield (above 5%) and investment grade (above 1.45%) are not yet at extreme levels, high yield CDS has risen to a new cycle high. 
    • Investor sentiment has fallen into extreme bearish territory with 19.4% bulls, 22.2% neutrals, and 58.3% bears while LEIs and industrial production and goods orders are showing the wear and tear of inflation. 
    • In an emergency meeting on Wednesday, the ECB pledged to “apply flexibility” when reinvesting PEPP proceeds and to address uneven impacts of policy normalization across jurisdictions. 
    • The BoJ stuck with its ultra-doveish policy keeping its target rate at -0.1% and reiterating its 10yr JGB target yield around 0% while the BoE hiked rates by 25bps as expected.
    This communication is provided for informational purposes only and is not an offer, recommendation or solicitation to buy or sell any security or other investment. This communication does not constitute, nor should it be regarded as, investment research or a research report, a securities or investment recommendation, nor does it provide information reasonably sufficient upon which to base an investment decision. Additional analysis of your or your client’s specific parameters would be required to make an investment decision. This communication is not based on the investment objectives, strategies, goals, financial circumstances, needs or risk tolerance of any client or portfolio and is not presented as suitable to any other particular client or portfolio.

    Secure Your Retirement

    Retire With Tucker

    Receive our market reports directly to your inbox.

    303-734-1234

    Tucker Financial Flash Memorandum: June 17, 2022

    Flash Memorandum: June 17, 2022

    On Wednesday of this week the Federal Reserve increased its benchmark federal funds rate by 0.75%, the largest single rate increase since 1994. The fed funds rate now stands at a range of between 1.5% and 1.75%. Fed officials expect the Fed to raise rates to at least 3% this year, with at least half of them indicating the fed funds rate may need to rise to 3.4% this year with rate hikes expected into 2023. Due to the clear connection between monetary policy and global economics and financial markets we feel compelled to provide clients with some insights and our current view of the landscape.

    The Fed has seemingly changed its tone in recent days, taking a much more assertive stance toward bringing inflation down to its target level. This hawkish pivot is remarkable in that it appears to be driven by: 1) headline inflation and 2) a single monthly data point (the May CPI report released June 10th). These two elements represent a major deviation from 40 years of Fed policy. Historically the Fed has emphasized core inflation, and the trend thereof, which excludes the more volatile categories of food and energy prices. Changes in food and energy prices are more volatile and often related to temporary factors. For instance, environmental factors can influence agricultural commodity prices and fluctuations in OPEC production targets impacts energy prices in the near-term.
    Both are examples of supply side stresses unrelated to trend changes in the economy’s overall price level and therefore not historically a material factor in monetary policy decisions.

    The image below shows the headline (all items) CPI index rising 8.6% for the 12 months ending in May, the largest 12-month increase since December 1981. The core (all items less food and energy) index rose 6.0% over the last 12 months, although it has fallen for the last two months including a decline from a 6.2% reading in April.

    top-line-contributions-and-core-cpi

    What does all of this mean and why is it important? Powell and his colleagues appear to be placing a larger focus on fighting headline inflation given trends in core data and narratives coming out of the Fed. Their preferred measure of core PCE has been declining since March.

    The Fed’s words and deeds suggest there is some tangible anxiety about the overall price levels and the perception that they have been well behind the curve. Powell blurred the concepts of core and headline inflation at his post FOMC press conference this week. As a result, markets are needing to factor trends in both headline and core inflation measures with a need for both to cool for the Fed to slow down the removal of accommodation. This will require food and energy prices to decline which are being driven overwhelmingly by the conflict in Ukraine. Supply side issues across commodity markets (grains and oil) need to begin to show healthier and improving trends for headline inflation to abate. 

    supply-chain-pressure-index

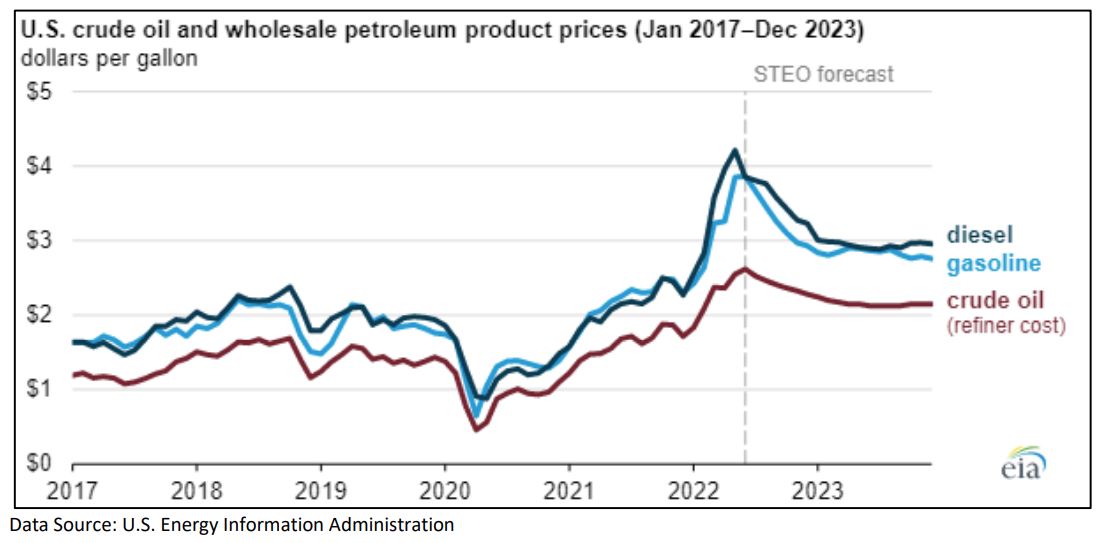
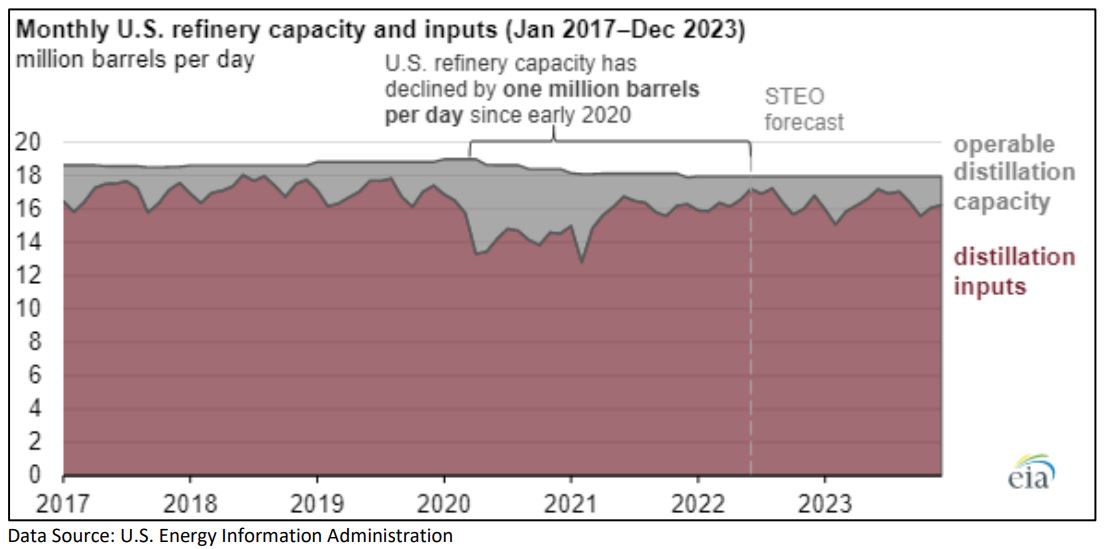
    Increasing rig counts, refining capacity utilization, and energy alternatives to Russian oil need to materialize before the global economy weakens and unemployment begins to tick higher. Very elevated crack spreads have EIA expectations for an increase in refinery utilization to average 96% this summer is expected to take some pressure off gas prices but reduced overall refining capacity since the beginning of the pandemic has complicated the backdrop.

    US-crude-oil-prices-2017-2023
    monthly-us-refinery-capacity-and-inputs

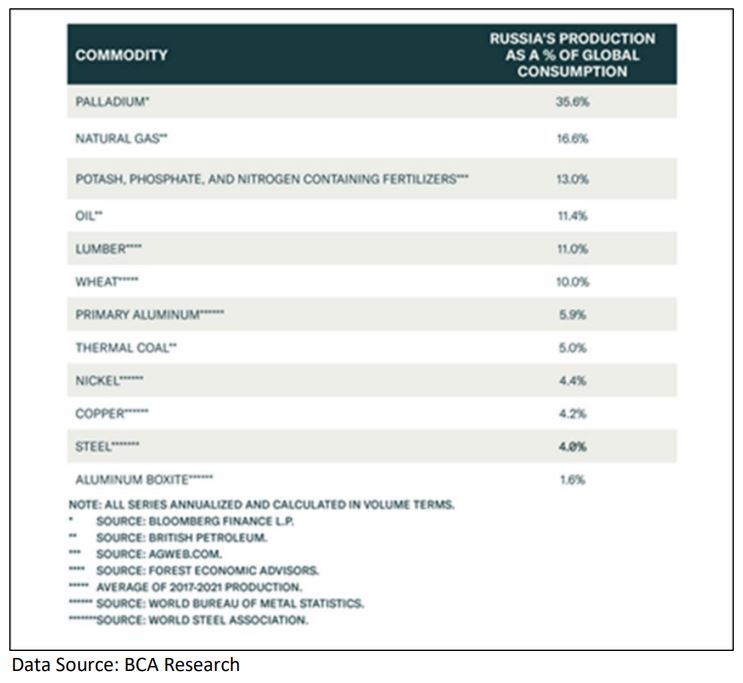
    Additionally, Russia and Ukraine are both major exporters of wheat. The war has disrupted the normal farming and export cycles, driving wheat prices up more than 50% since a year ago. The prices of many other foods, ranging from grains to meats and oils have risen dramatically in recent months.

    russian-commodities

    Rising prices mean workers experience pay cuts when it comes to real wages. Even though average hourly earnings rose 0.3% in April, the net effect is a decline in real wages of 0.6% when accounting for inflation. On a 12-month basis, real average hourly earnings were down 3% in May.

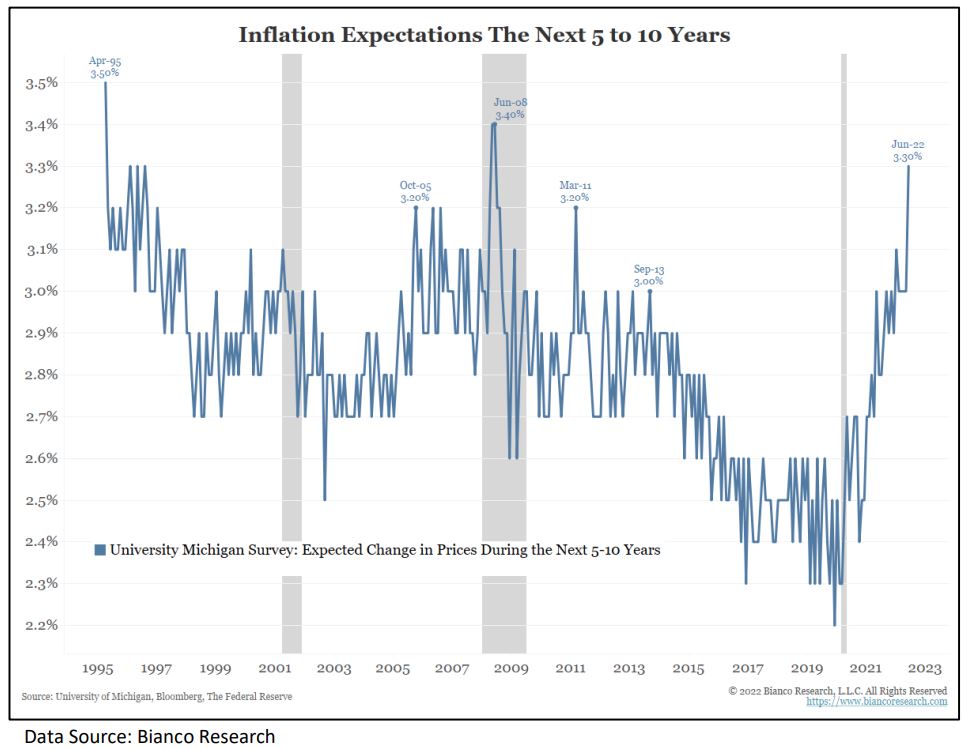
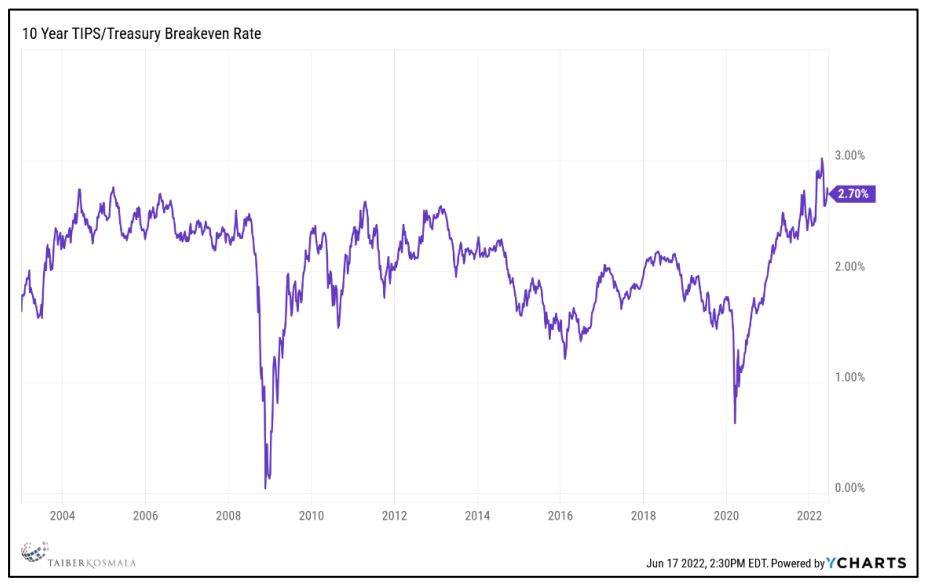
    Although the market’s expectations for inflation (observable via TIPS break-even rates or 5-year forward inflation swaps) remain anchored at 3%, the University of Michigan Surveys of Consumers year-ahead inflation rate was 5.4%, up from 4.2% a year ago. The expectation for the next five years is 3.3% annually. This has clearly impacted Powell’s pivot to increasing hawkishness. Awareness of consumer sentiment becoming a major component of the Fed’s calculus suggests it needs to be scrutinized more closely by market participants, by extension. At his news conference, Powell said the Michigan survey helped push the central bank away from a 0.5% increase that had been expected only a week earlier. The Michigan Consumer Sentiment Index comes out twice each month, once in a preliminary reading, and then, two weeks later, in final form. The final Michigan reading this month comes out June 24th, two days after Powell presents his Monetary Policy report to the Senate Banking Committee. The Michigan survey is directly correlated with food and energy prices, essentially representing another pivot to headline inflation from core. 

    inflation-expectations
    10-year-TIPS

    Finally, the trajectory of Federal Reserve rate hike forecasts this year have risen from 65 basis points in December 2021, to 175 basis points in March, to 341 basis points this week. It appears markets have lost confidence in the Fed’s forecasting abilities; hence, rate uncertainty and attendant equity volatility will persist until energy and food prices begin to decline.

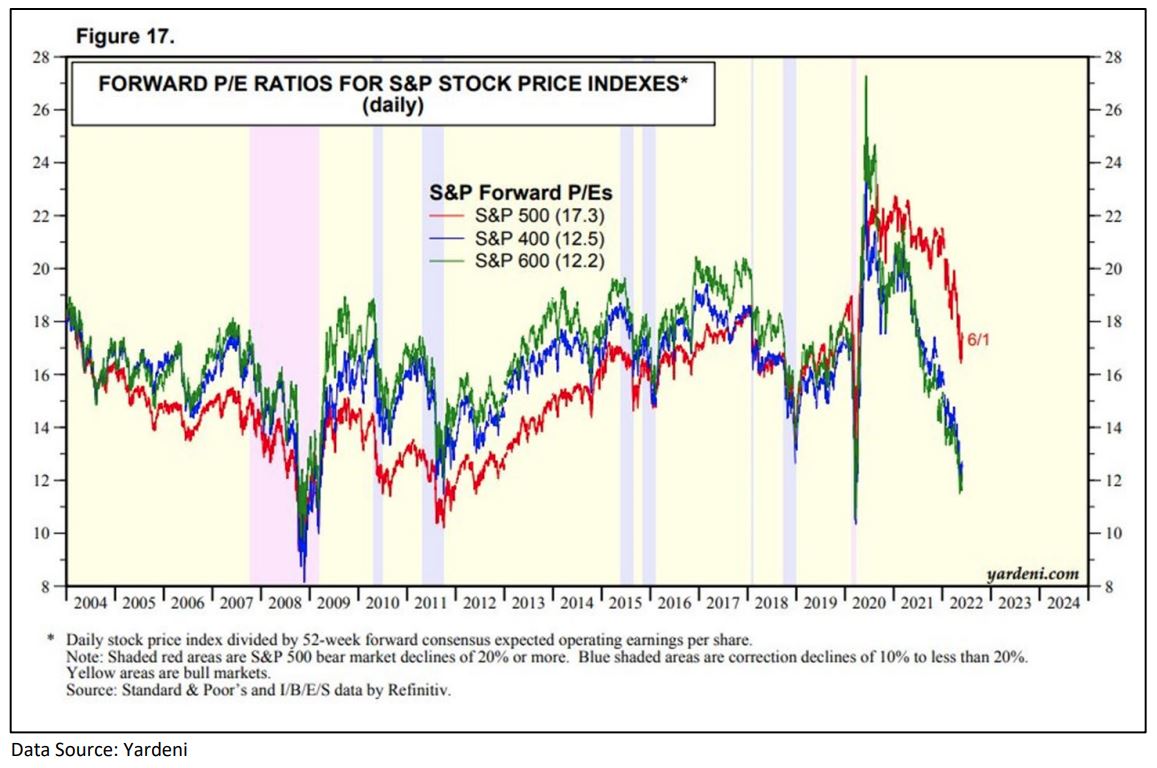
    As calendar year 2022 commenced, consumer balance sheets were strong, and savings abundant. Corporate revenues and profit margins were also vibrant. The market is clearly pricing in declining economic activity in the form of significant compression in P/E multiples because of the inflation backdrop and increasing central bank hawkishness. The S&P 500’s P/E multiple has compressed by about 22%, nearly equal to the decline in the index.

    forward-pe-ratios-for-s&p-stock-price-indexes

    Although recession indicators are still not flashing an imminent decline in economic growth, the odds of that occurring have risen in recent weeks. Given the Fed’s recent focus on headline inflation (which it cannot control outside of intentionally orchestrating a recession), the odds of them engineering the ‘soft landing’ have fallen,
    leaving markets on edge.

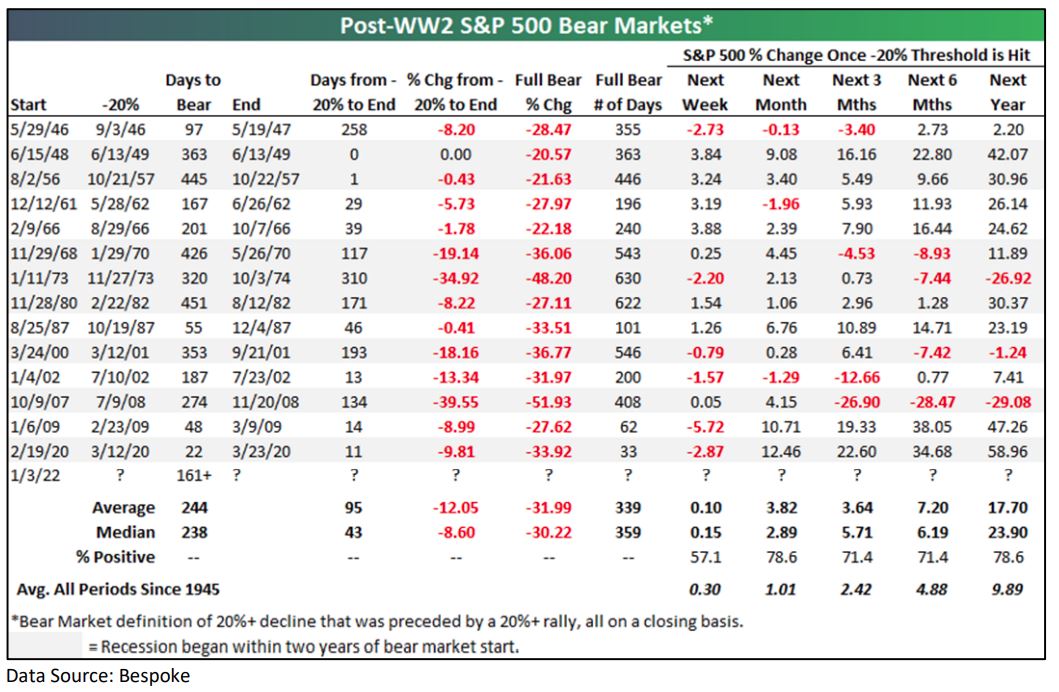
    There have been two bear markets in history which proceeded to fall notably after the initial ‘bear market’ 20%+ correction, 1973-1974 and 2008-2009. In both cases the U.S. economy fell into very deep and persistent recessions. If the Fed can engineer and maintain a modest economic backdrop as supply chains heal including supply side responses in both food and energy markets, equity markets (particularly emerging markets) are attractively priced when viewed over the intermediate term (1-3yrs) as the historical data below reminds us. That said, the bear market is here but potentially incomplete due to a likely decline in corporate profitability (rising rates, profit margins) and a persistent tax from high inflation.

    postww2-sp500-bearmarkets

    Bond yields probably overshot in the near term given the increased odds of recession which leads us to a moderately cautious stance on credit and neutral duration guidance from an interest rate risk perspective. In the end, trading in volatile markets is exceedingly difficult and should be minimized. Minor tactical rebalancing to maintain proper asset class exposures is advisable with equity markets now officially in bear market territory and bond markets off to their worst calendar year start on record.

    Market Anecdotes

    This communication is provided for informational purposes only and is not an offer, recommendation or solicitation to buy or sell any security or other investment. This communication does not constitute, nor should it be regarded as, investment research or a research report, a securities or investment recommendation, nor does it provide information reasonably sufficient upon which to base an investment decision. Additional analysis of your or your client’s specific parameters would be required to make an investment decision. This communication is not based on the investment objectives, strategies, goals, financial circumstances, needs or risk tolerance of any client or portfolio and is not presented as suitable to any other particular client or portfolio.

    Secure Your Retirement

    Retire With Tucker

    Receive our market reports directly to your inbox.

    303-734-1234

    Subscribe To Our Newsletter

    Subscribe To Our Newsletter

    Join our mailing list to receive the latest financial news and tips

    You have Successfully Subscribed!